BTC and ETH Analysis: Market Forming Pennant
Check out what TradingView analysts are seeing in the market and don't miss any movement in the market cryptocurrency and Bitcoin (BTC) market and economic calendar.
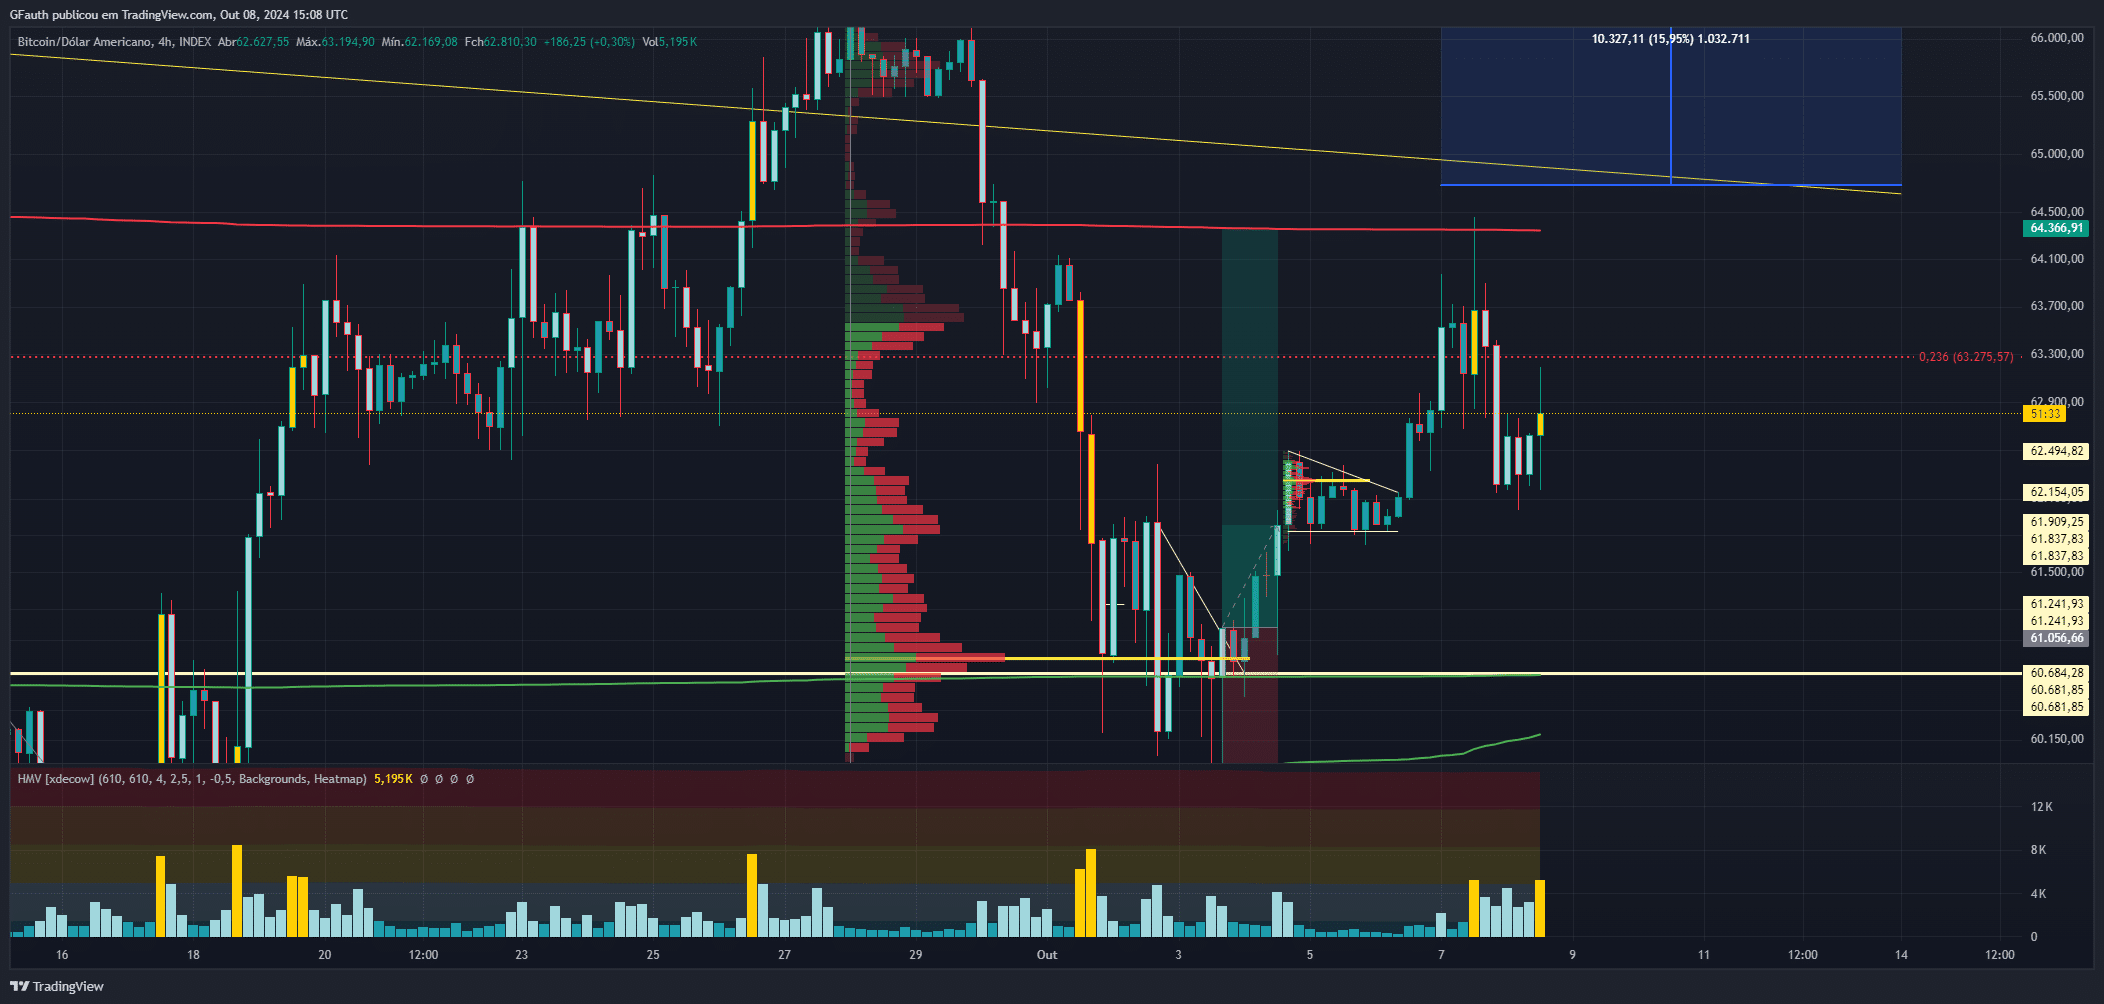
BTC Analysis – Badboycp
Bitcoin has recovered some of its decline since the end of last month. But will this week continue to be on the rise?
As we can see in the chart above, BTCUSD continues in a downward trend on the weekly chart that has lasted 210 days. Last Friday, October 3rd, BTC showed a recovery of 4.92%.
In a cautious scenario, we can project this continued rise to US$66,287.52. To enter a new direction, BTC should break this top and set off on a new upward journey. And how could I trade BTC this week?
- – Without much emotion (little money) until the previous top, that is, US$ 66,287.52;
- – Wait for the channel’s downtrend line to touch and catch the reversal until the middle of the channel, around US$58,356;
- – Wait for the upper line of the channel to break and go to the nearest top, at around US$70,040.


BTC Analysis – IvestAnalysisBR
No Ethereum 15 minute chart the price is forming a figure that resembles a pennant, a continuation figure that, if it breaks upwards, could seek the target in the region of U$2,500.00, with possible resistance at U$2,474.00.
However, when looking at the daily chart, the scenario is different, not corroborating this formation. According to Alexander Elder's “Triple Screen” concept, this divergence between chart times would prevent a favorable entry to break this pennant. Still, I consider it important to highlight this analysis.
Only above US$2,420.00 can you begin to consider a possible breakout of the pennant upwards. I will continue to keep an eye on trading volume, especially with the weekly candle close approaching.
We can clearly see that on the 4-hour chart, the price can break a downward pivot, which makes it difficult to think about this pennant breaking in 15 minutes, anyway, I continue monitoring. 4-hour chart (average of 200 periods above the price, indicates that the price may continue to fall).
Triple Screen
Often, this divergence of trends at different chart times can sound like an inconsistency to anyone observing price movement. However, this is one of the characteristic ambiguities of graphical analysis.
Each time frame offers a different perspective on the asset's behavior, and these divergences are common and natural. Alexander Elder's “Triple Screen” concept reminds us precisely of the importance of observing the broader context before making decisions, even when, in shorter time frames, a formation like the pennant appears promising.
Disclaimer: The analyzes presented here are only studies. They are not investment recommendations, neither buying nor selling, nor do they reflect the opinion of the media vehicle in which they are being published. These are studies aimed at people with knowledge and experience in the financial market.

